Downloading your data (Download CSV)
All collected and synced data is available for you to download in a CSV format from the server. Each file downloaded contains some metadata output plus all of you variables. To find out how your variables map to the values in the csv file, please inspect your meta data export first (accessible from the form printing action under the Author tab)
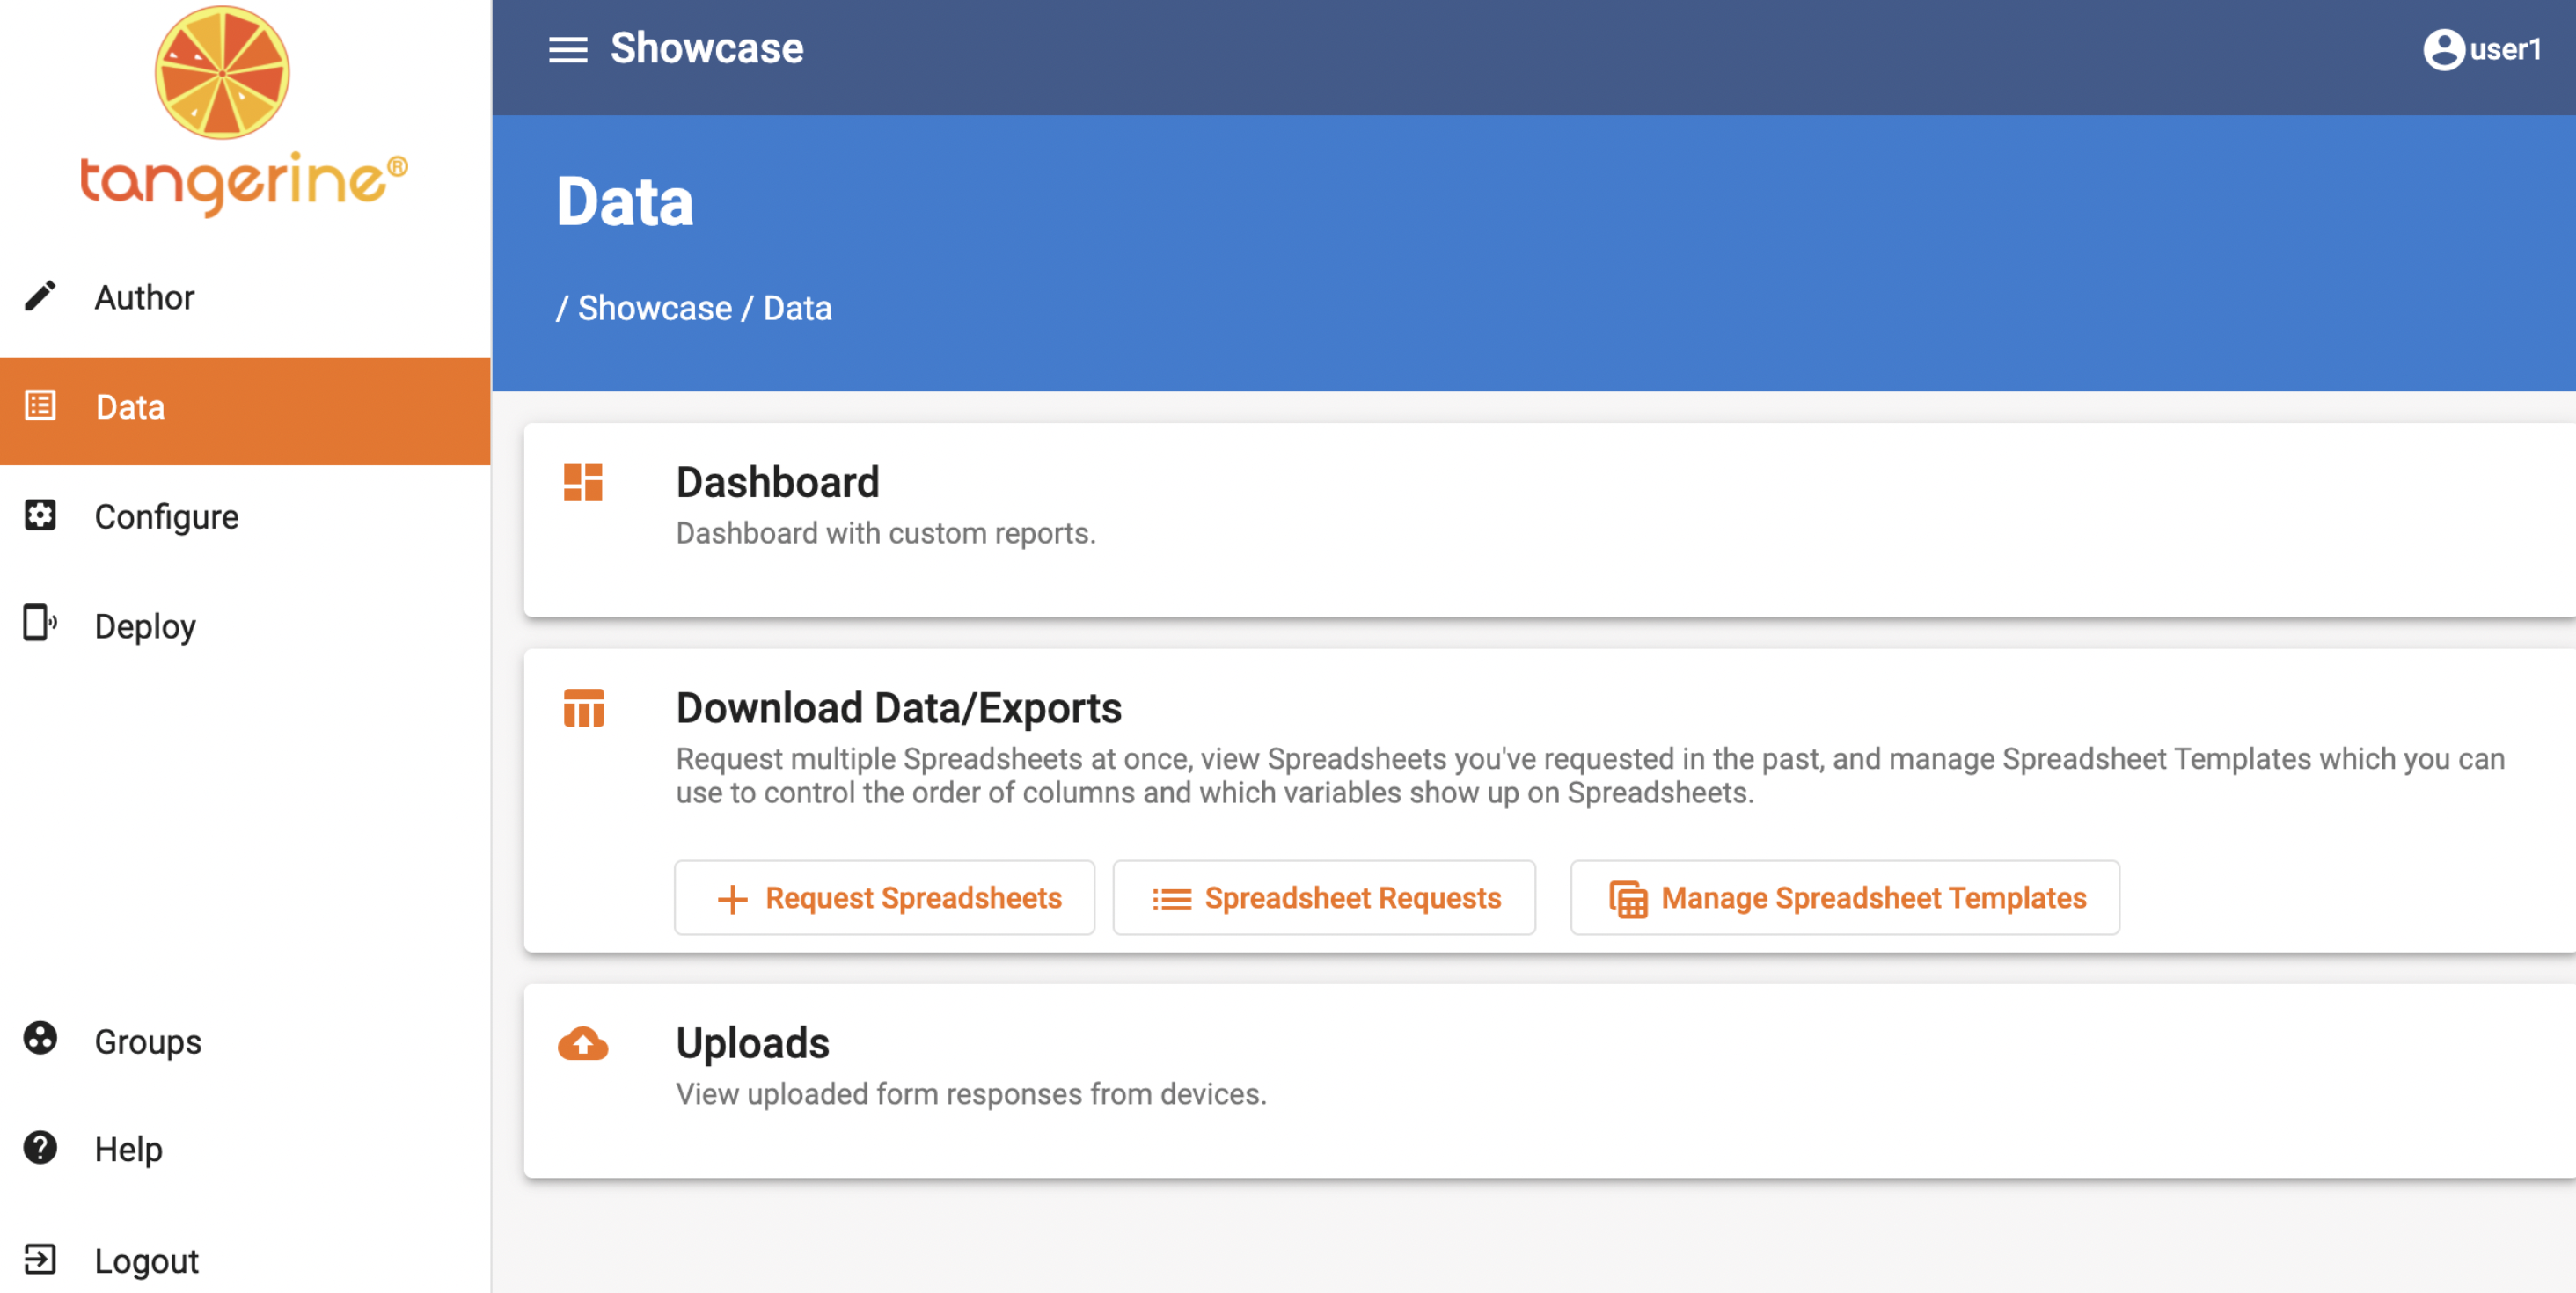
To access the csv generation and download screen go to your group and then select Data. Depending on the permissions you have for your group, you will see Dashboard, Download Data/Export, and Uploads tabs available for selection. Under the Download Data tab there are 3 options:
Request spreadsheet - here you can create a download link for your csv of bundle multiple export files in a zip Spreadsheet Requests - here you will find a historical of generated requests that contain the exported data for the selected forms, at the time of the request. Note that we delete this links after one month, meaning that here you will see active links for only the past month Manage Spreadsheet templates - this links allows you to name and create a template with only selected columns for your csv export
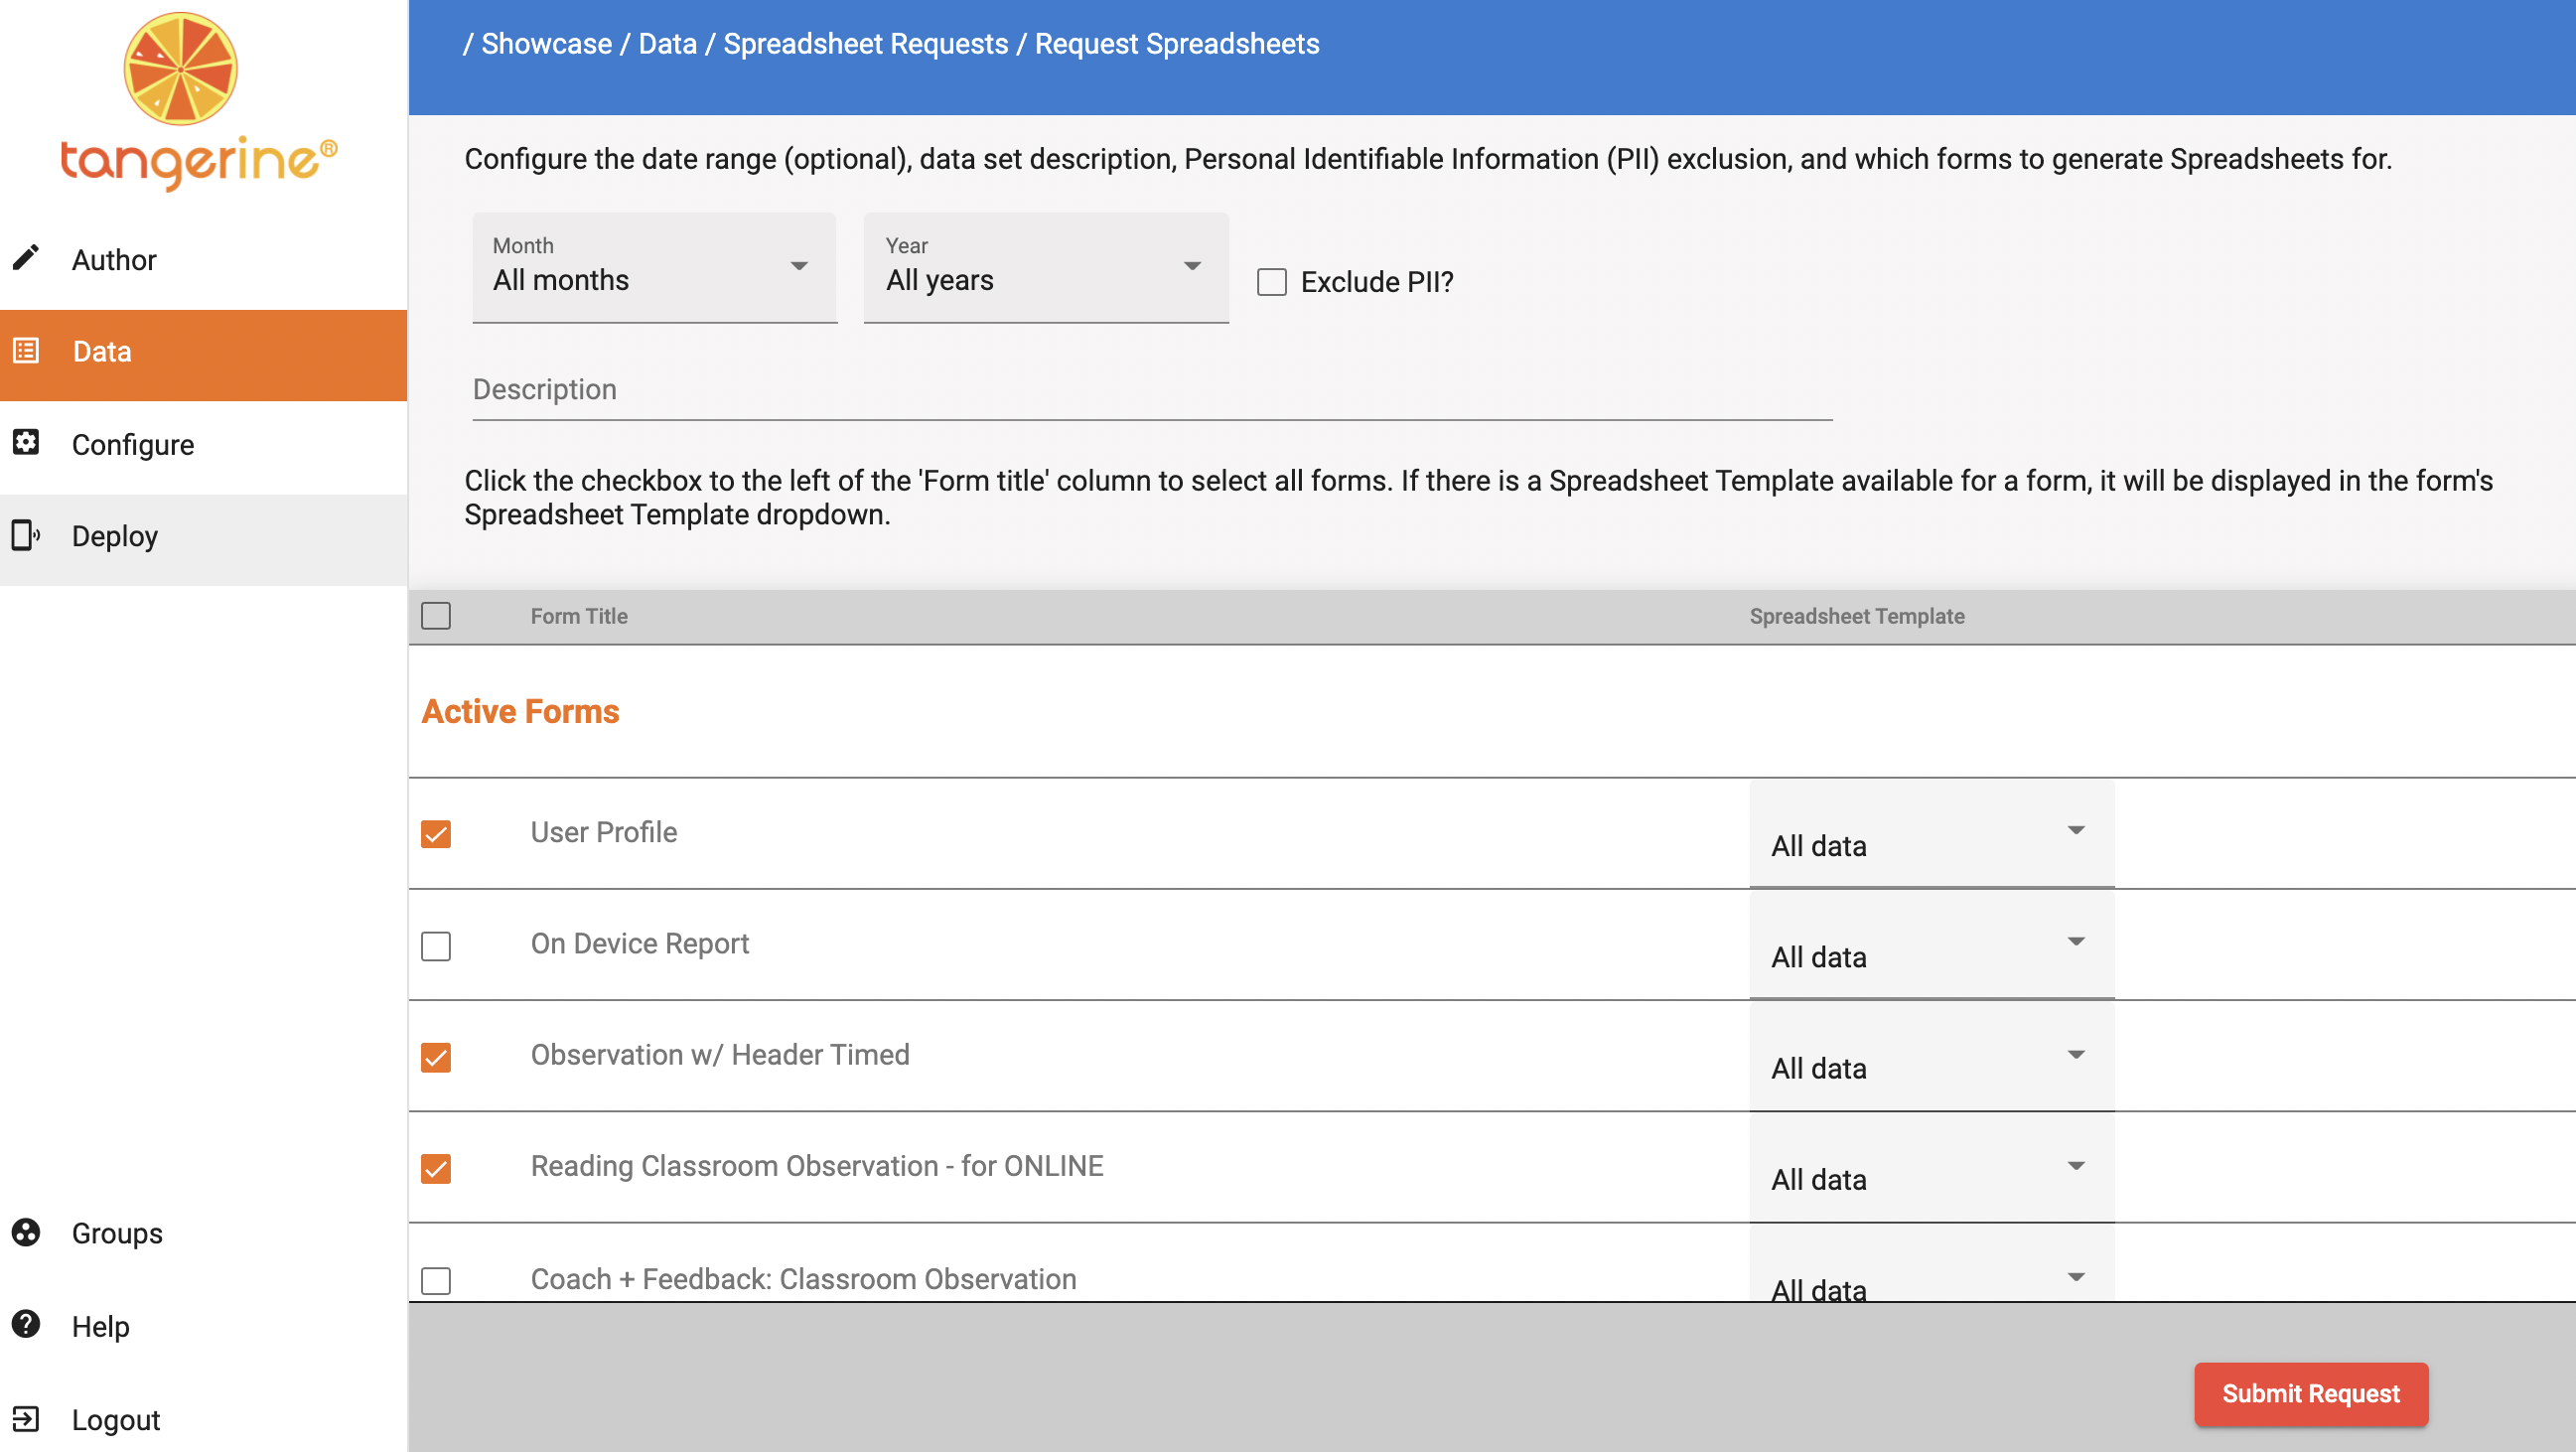
Let's see how to generate a spreadsheet. Click the Request Spreadsheet button. On the next page you will see a header filter, where you can select the month and year for the export, or leave as is to export all data. You will also see a filter for "Exclude PII" - marking this option allows you to exclude personal information from the export (Note that only variables that have been configured as PII will be excluded). If you want you can also give an optional description to your Request.
Under the form selection area, you will see that you can select multiple form results to be exported or all forms. If you have created a data template you can slo select it from the drop down list, otherwise leave as "All data"
In the below example, we have 3 forms selected and no filters for month/year. Click the Submit Request button to start the export generation. Note that while the generation of the file is in progress you can mouse away and do other actions in Tangerine. We will see how to get to a previously generated request further down.
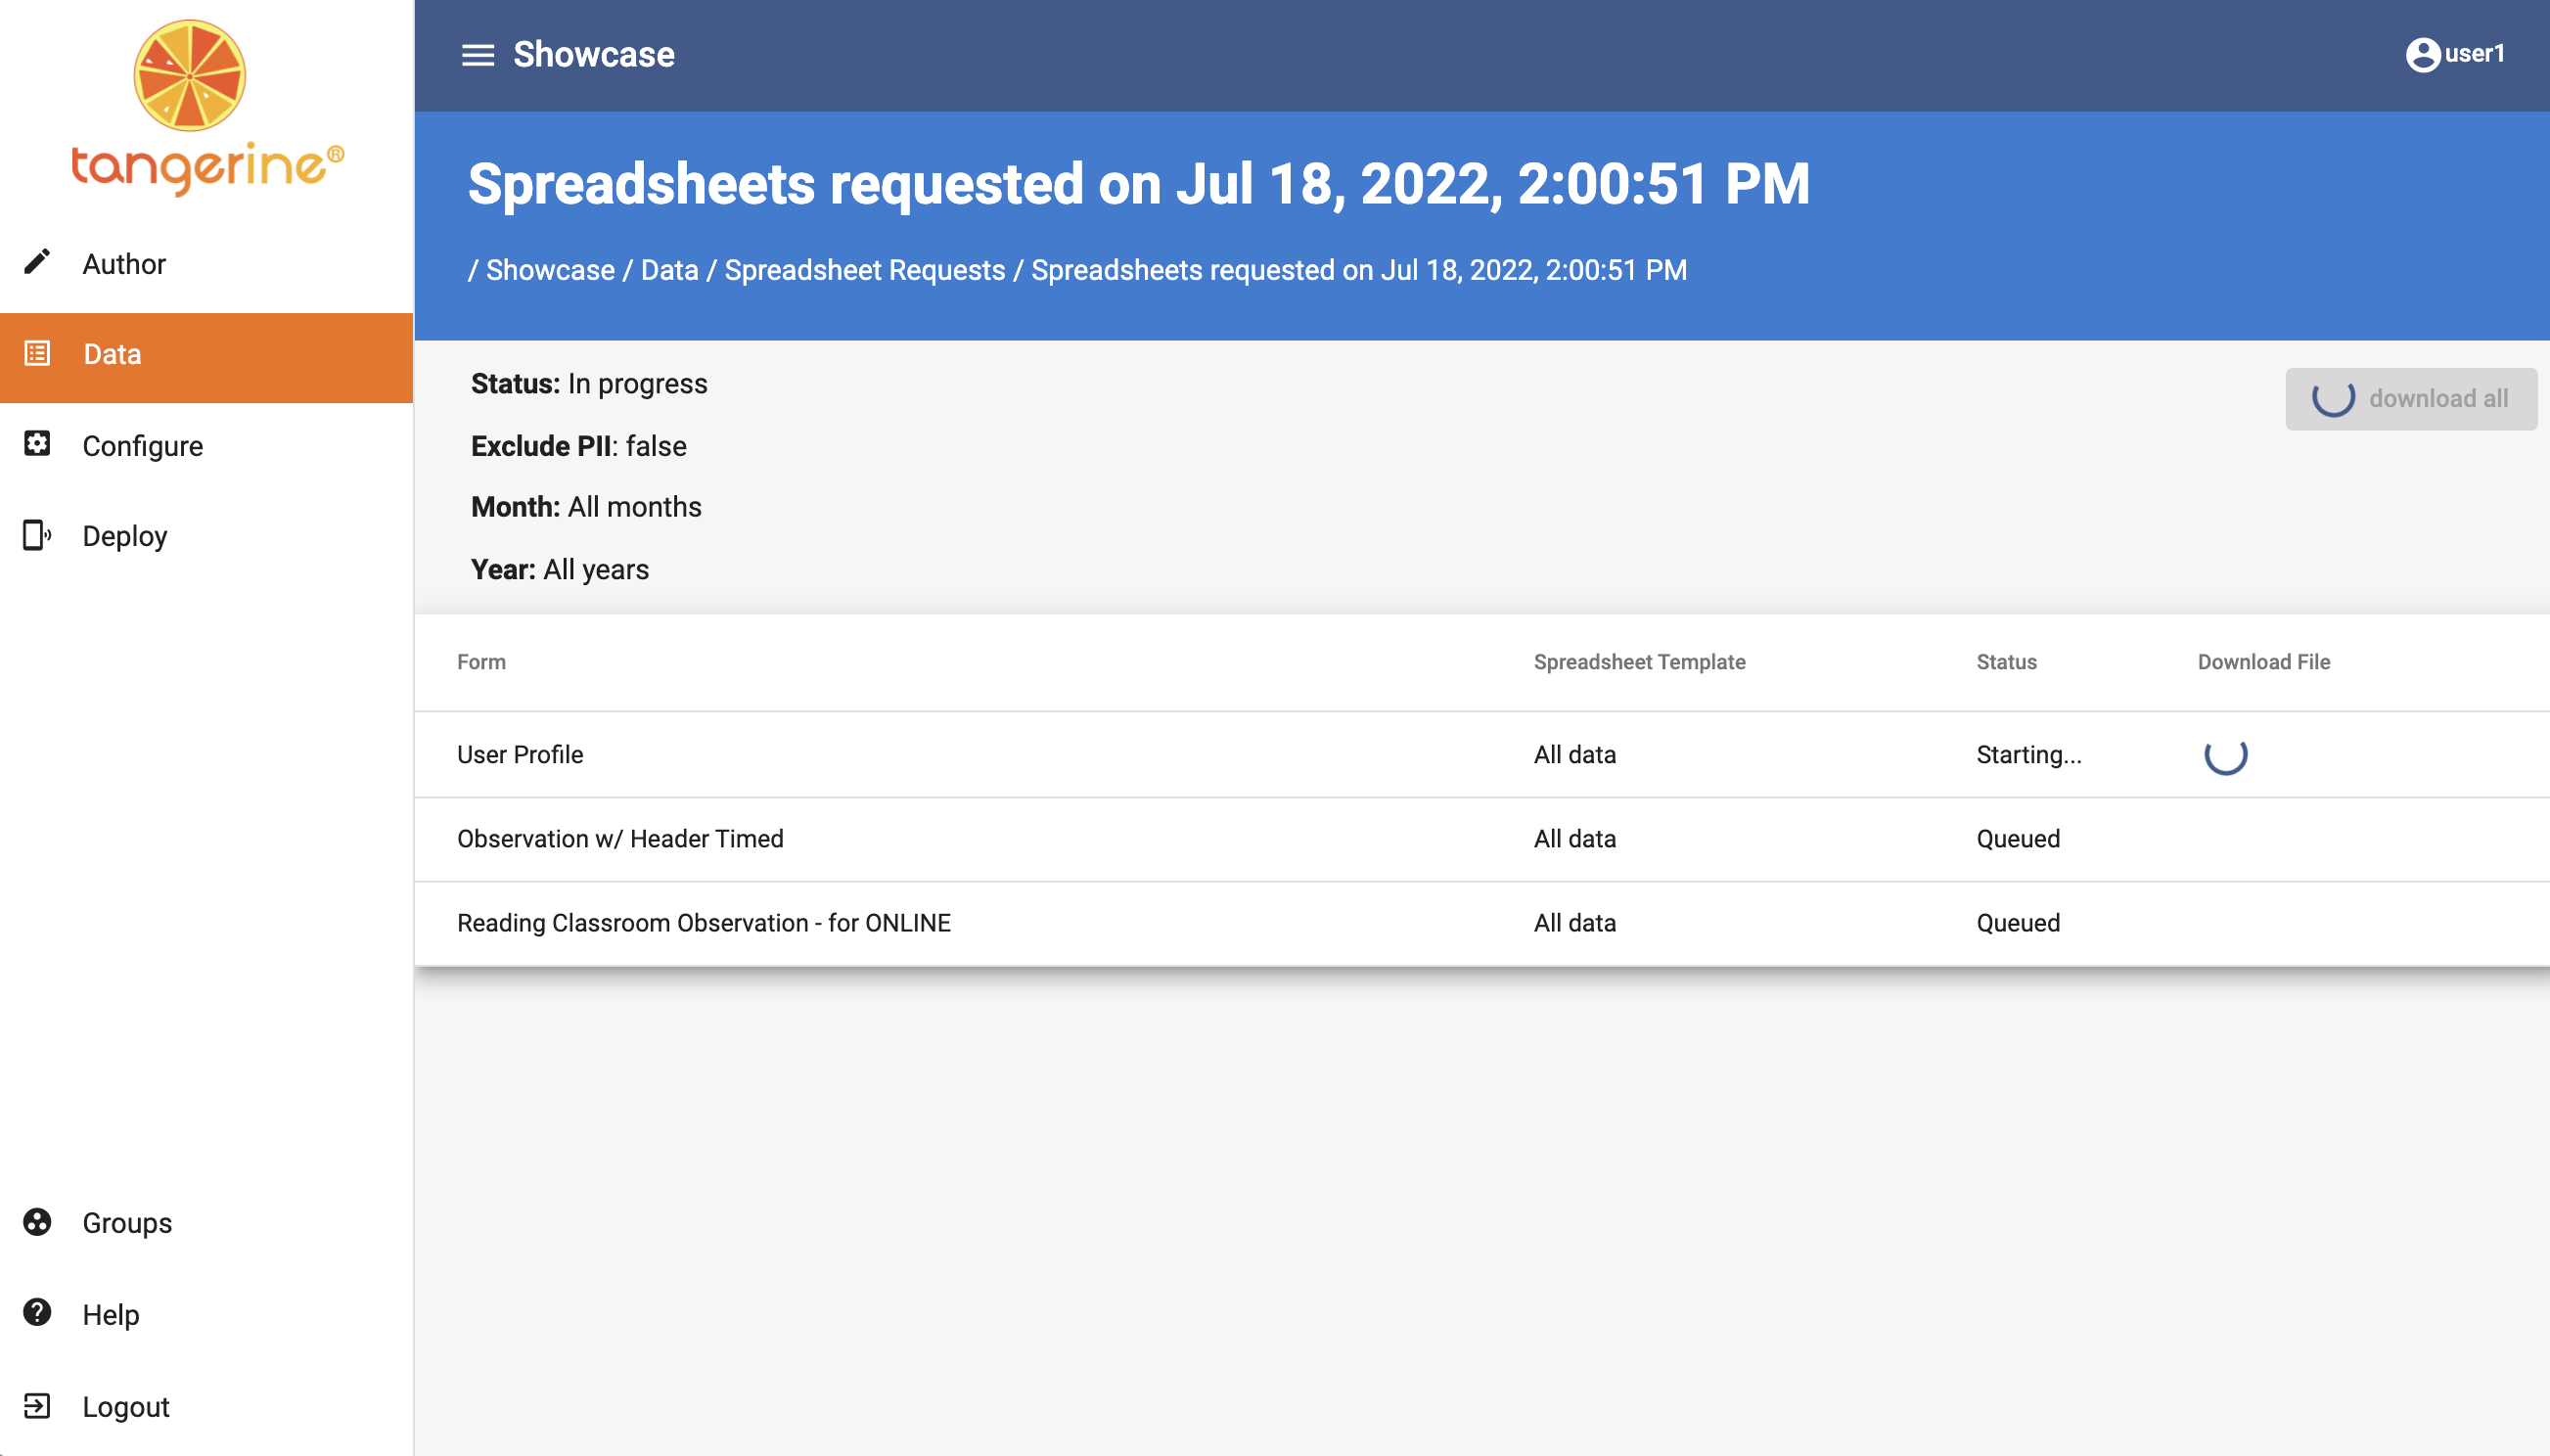
While the files are being generated you will see their status updated.Below I see that there are 3 forms in the queue, the first one is starting, and the other two are queued. You can also see. on the top right the "download all" button is greyed out
Once the files are generated and the request completed you can download them. On the below screenshot we see:
We can download each of the files individually by clicking Download file link on the right side of each form name We can download all files in a zip but clicking the Download all button on the top right.
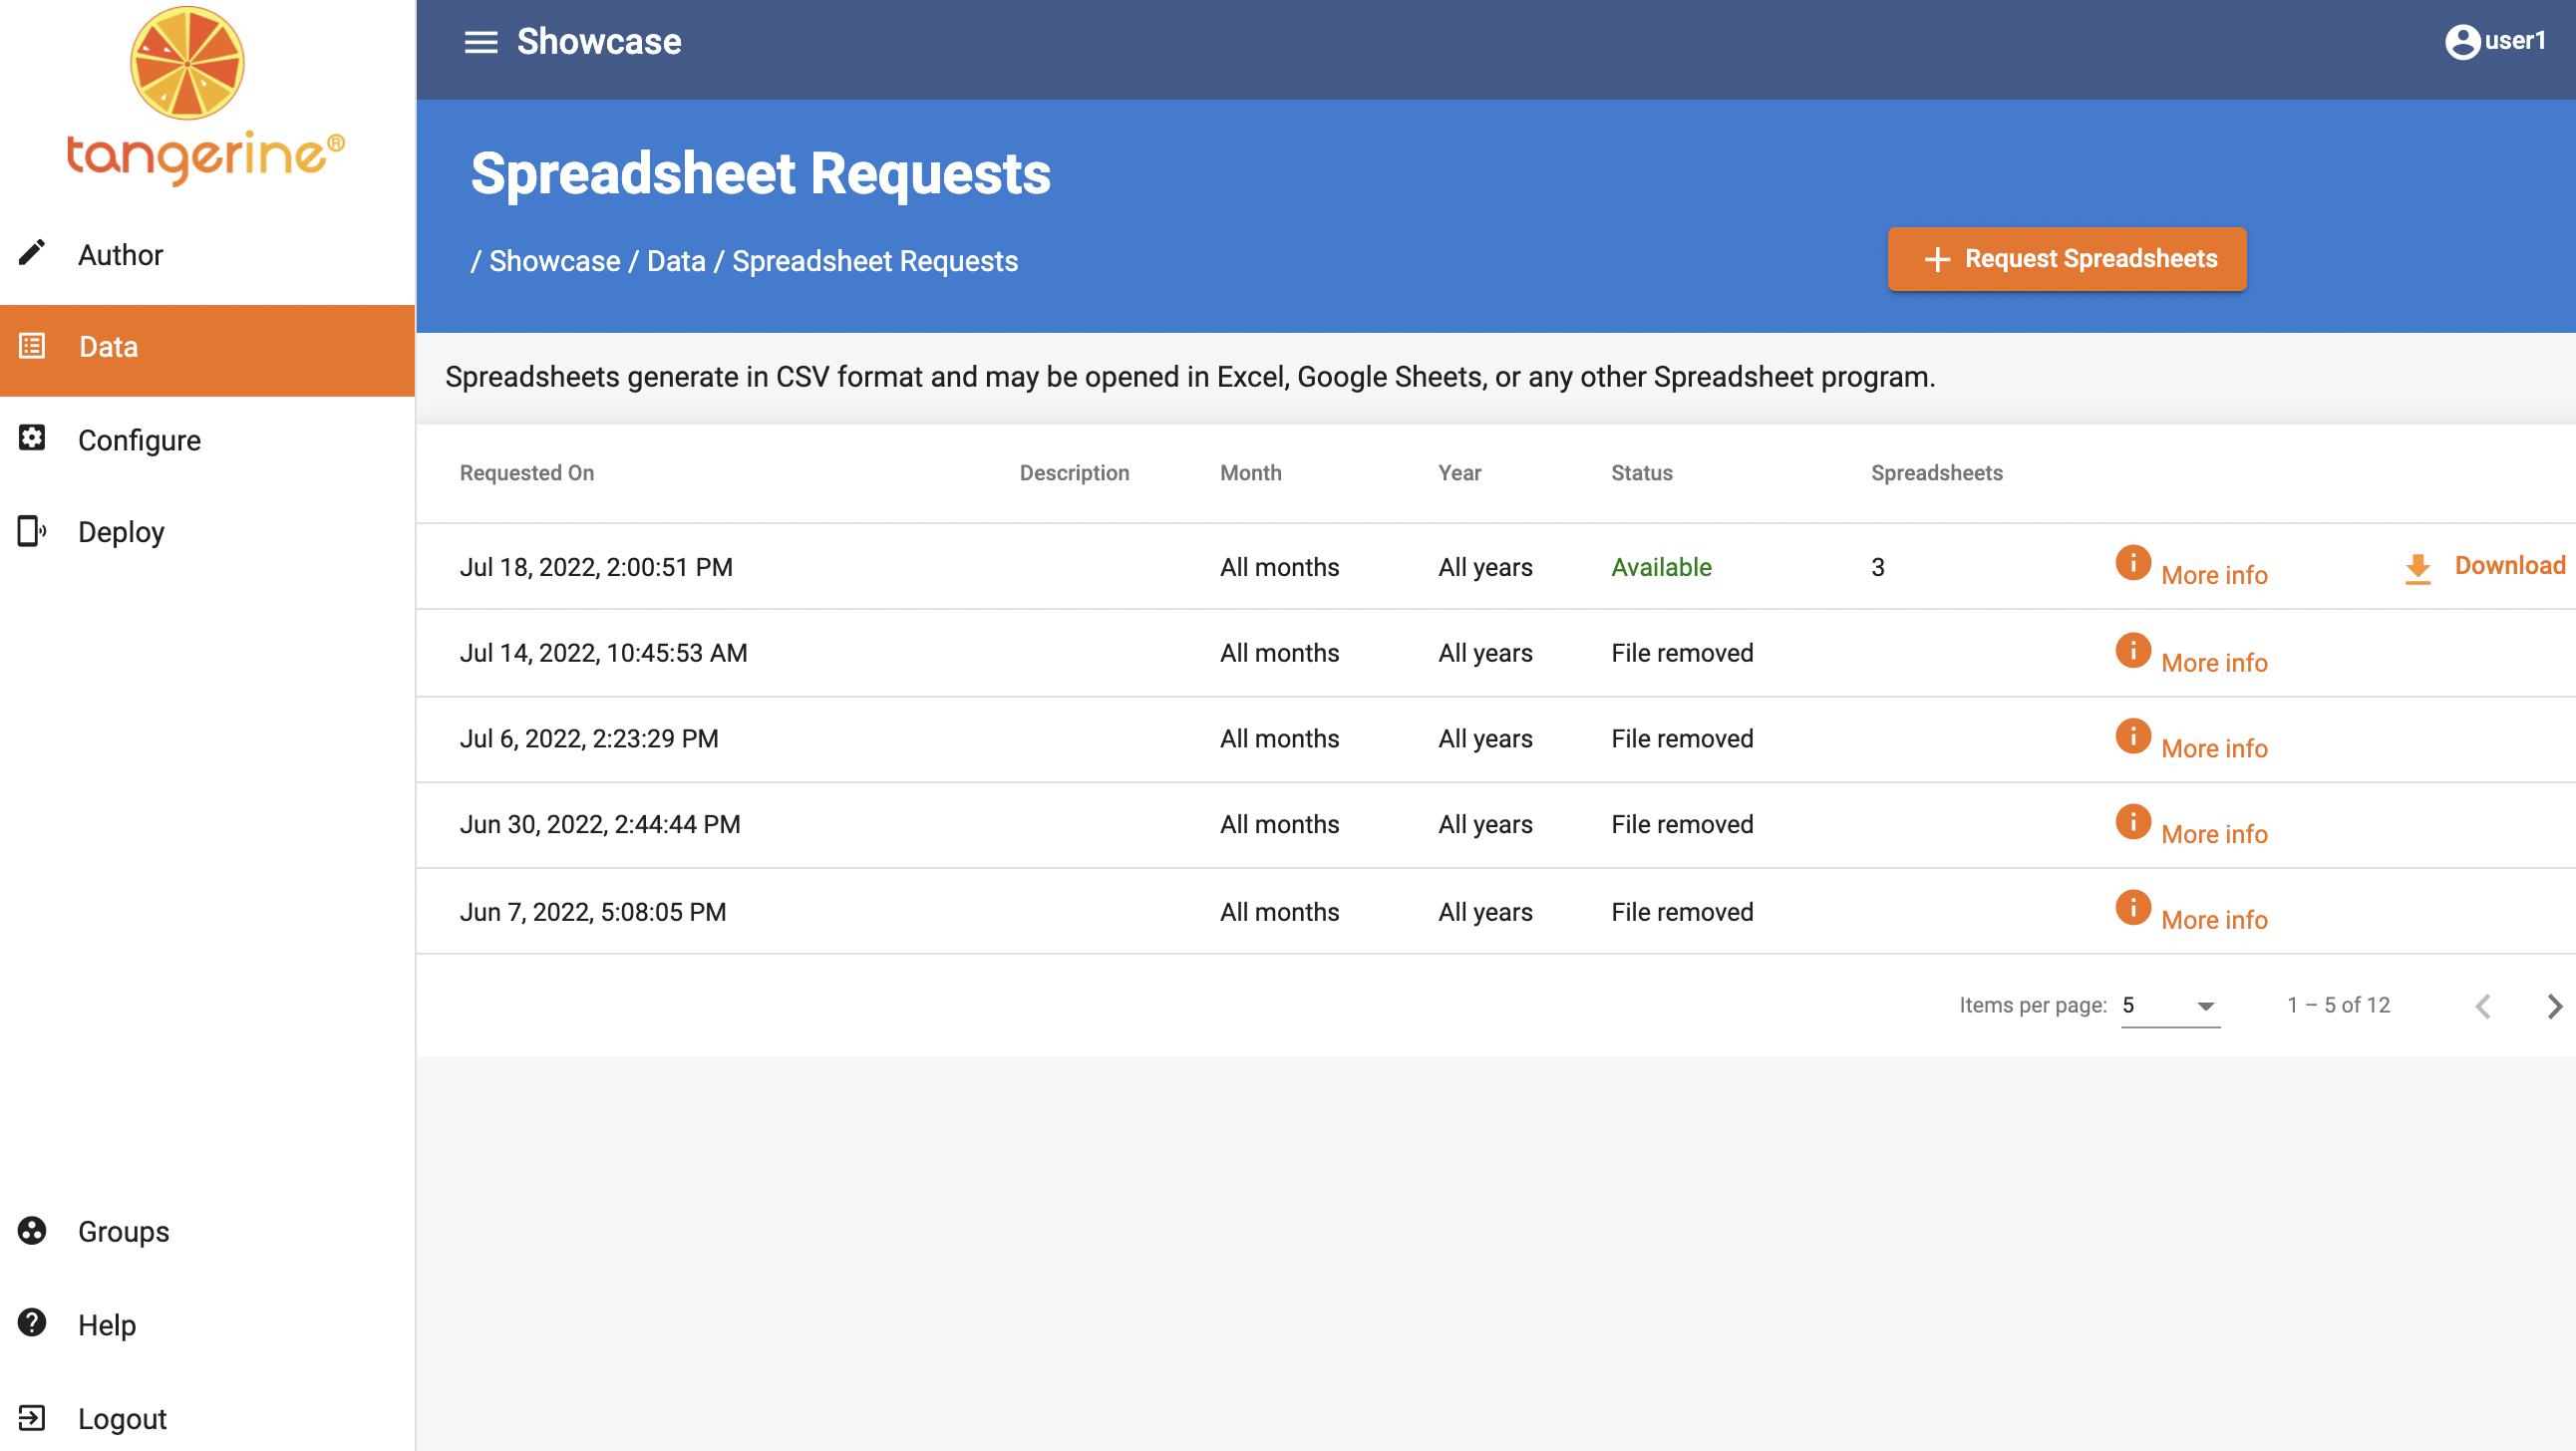
Now let's go back to the Data tab. This time under the Data Download option click the Spreadsheet Request button. This will bring you to all historically generated spreadsheet requests. On the below screenshot I see that there are 12 pages of previous/historical requests. On the most recent page, which is the one that loads by default, I see that the top file is with status Available, meaning that I can download it and the rest of the requests on this page have already been removed, since they are older than 1 month. The status for those is File removed and there is no link. From this screen, you can hit the download button beside the request to get the zip file containing all form results. Or, you can click the More info link to go to the same screen that we saw earlier during the file generation and download the files individually.
Warning
To make use of the Exclude PII function, all of your personally identifiable inputs must be marked like such on the input edit page, or when inserting a new input/question on the insert new input page. All data must be collected prior to this configuration
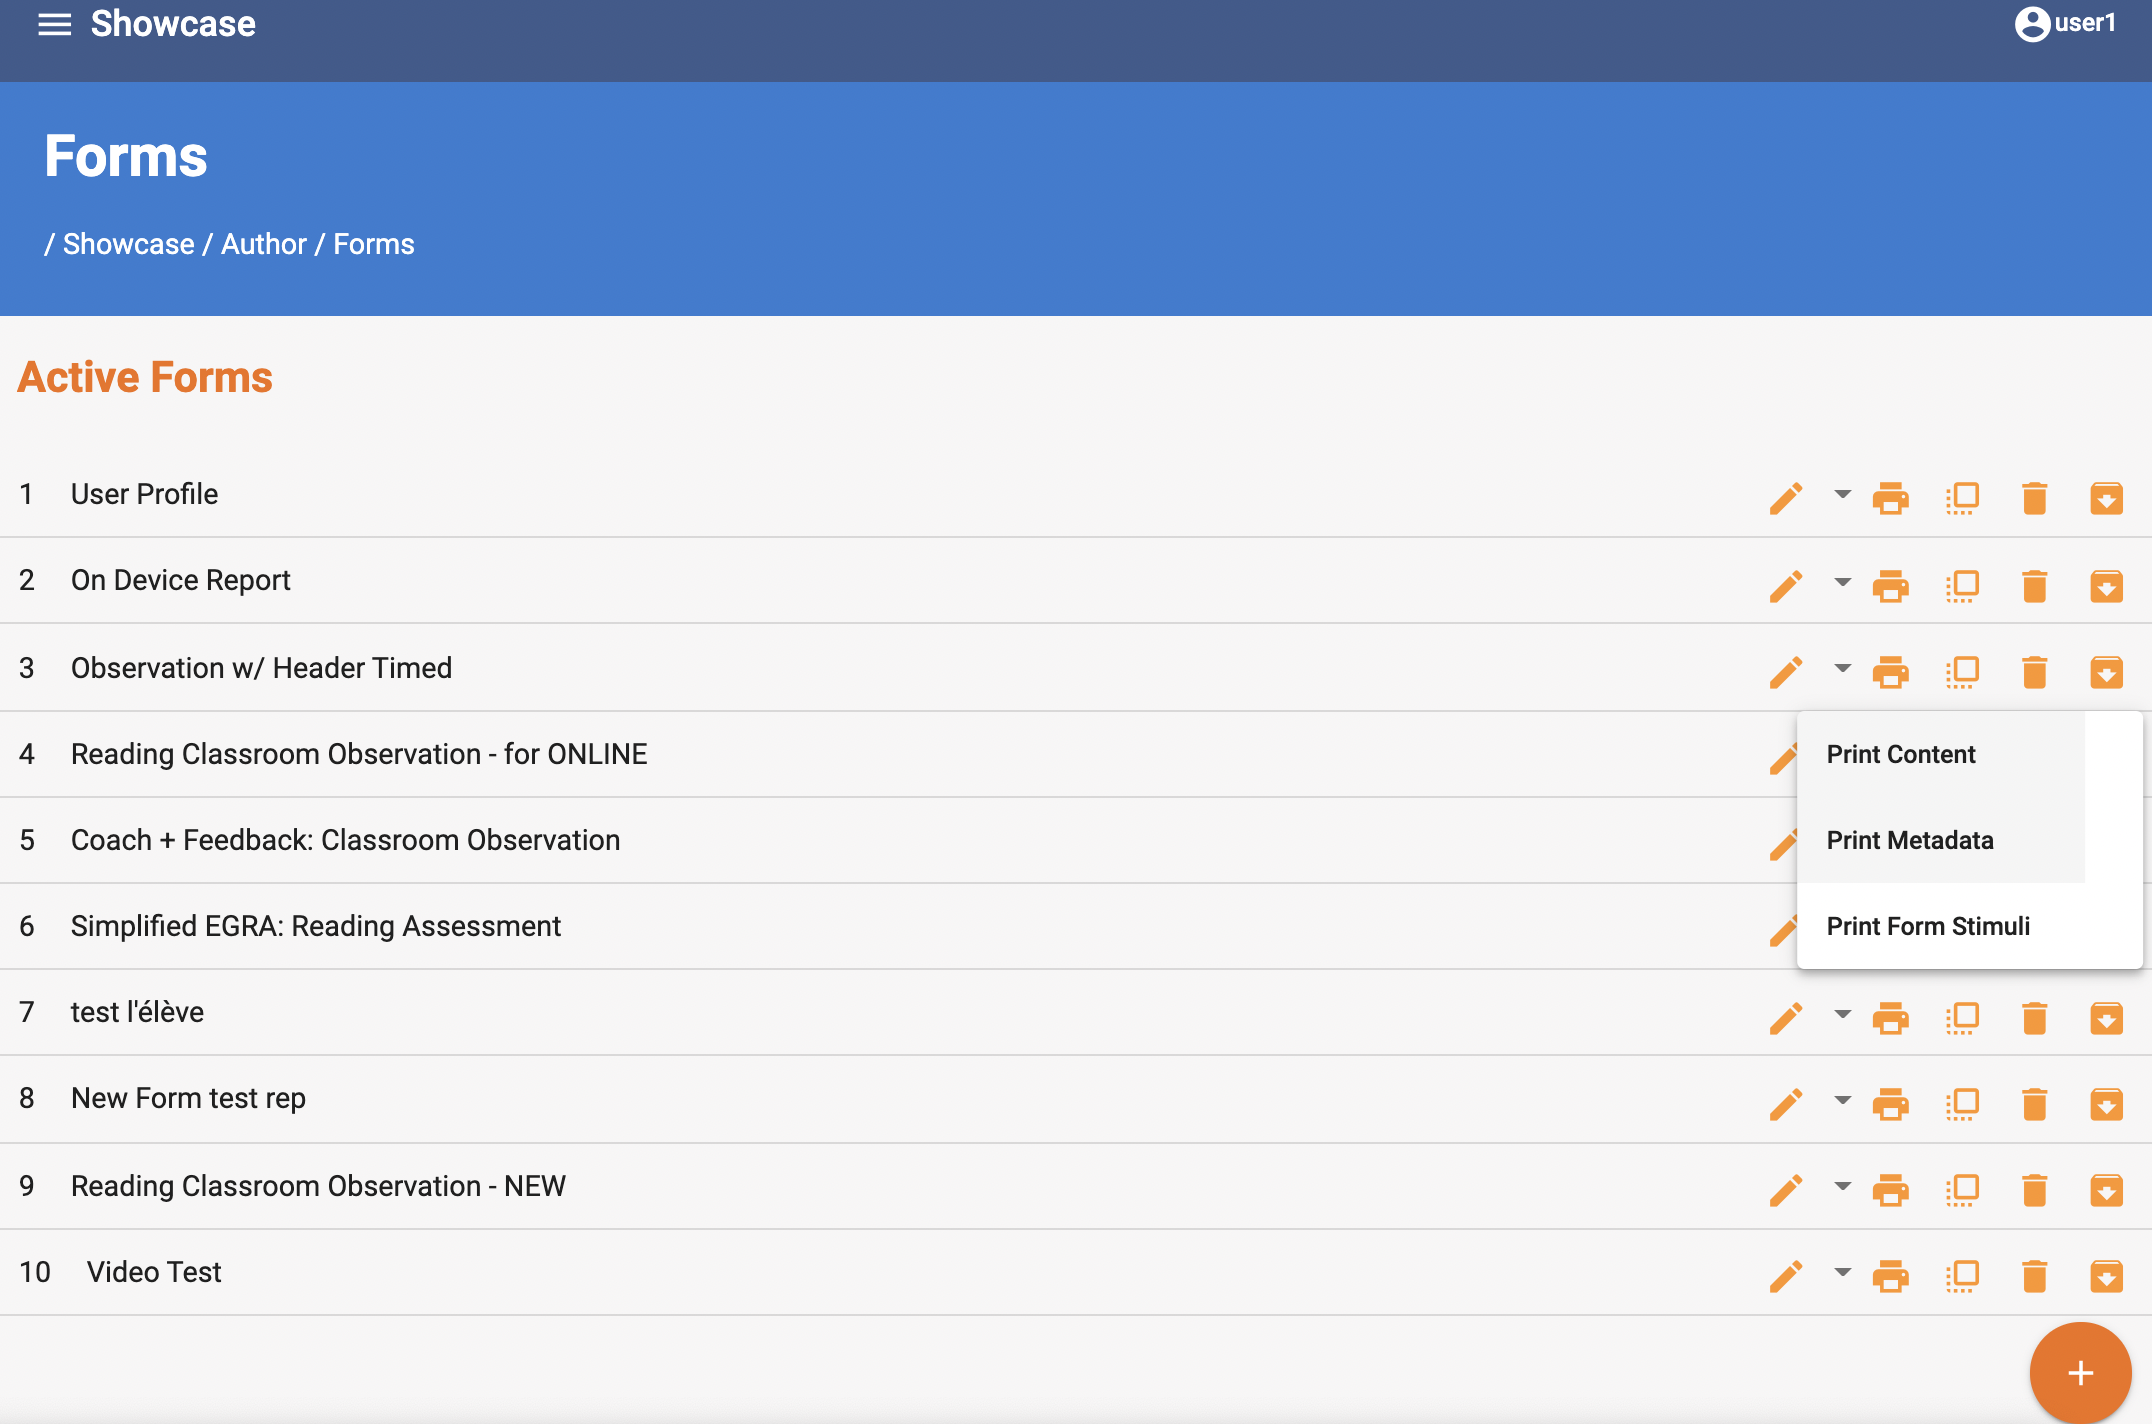
To correctly interpret your data you need to know each variable and the corresponding values for the answer option. Please use the form's metadata print function under the form listing (go to Author->Forms). Access the metadata by clicking the print icon next to the form name and then select metadata.
Each CSV file includes all data from the form responses. We can think of these data as data and metadata. Each line of the data file represents one data entry for your instrument. The values displayed under each variable correspond to the values you have assigned to each response option when designing your instrument.
For each variable in Tangerine you will see a column or columns in the csv file. Some outputs like checkboxes and grids spread across multiple columns. For checkboxes you will see a column named using a this pattern "VariableName_Value". This means that for each option value pair for the checkbox group there will be a column . Similarly grids provide columns named ""GridVariableName_ItemPosition" meaning that for each item in the grid you will see a column with the item position.
If the CSV generation was successful, the following screen will present the group name, Form id , Start time and progress of the CSV download. Click Download to download the file.
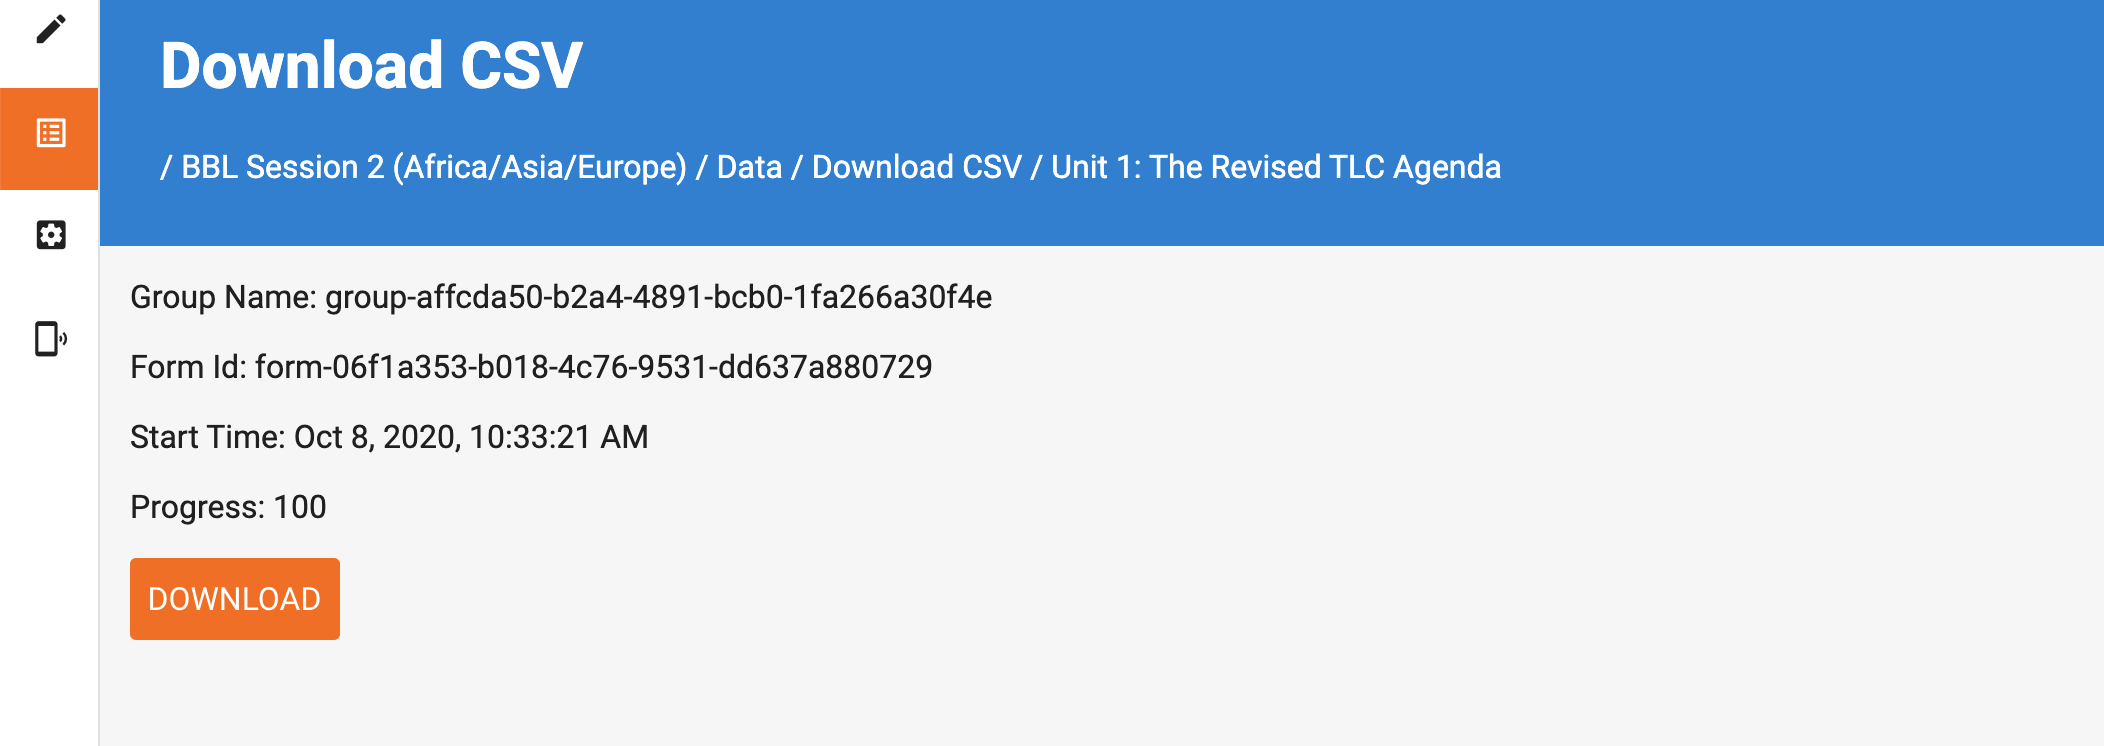
Once the CSV has been downloaded, you can find it in your Downloads folder.
Metadata included in CSV
To correctly interpret your data you need to know each variable and the corresponding values for the answer option. Please use the form's metadata print function under the form listing (go to Author->Forms). Access the metadata by clicking the print icon next to the form name and then select metadata.

Each CSV file includes all data from the form responses. We can think of these data as data and metadata. Each line of the data file represents one data entry for your instrument. The values displayed under each variable correspond to the values you have assigned to each response option when designing your instrument.
For each variable in Tangerine you will see a column or columns in the csv file. Some outputs like checkboxes and grids spread across multiple columns. For checkboxes you will see a column named using a this pattern "VariableName_Value". This means that for each option value pair for the checkbox group there will be a column . Similarly grids provide columns named ""GridVariableName_ItemPosition" meaning that for each item in the grid you will see a column with the item position.
Each csv output from data collected by Tangerine has a set of metadata variables that are automatically output. Here is the current list:
| Variable Name | Meaning |
|---|---|
| _id | 32-digit uuid identifying the unique form taken |
| formId | text name of the form |
| startUnixtime | unix timestamp that the form was first opened |
| endUnixtime | unix timestamp that the form was completed |
| lastSaveUnixtime | unix timestamp that the form was last opened and saved |
| buildId | 32-digit uuid identifying the app version |
| buildChannel | type of build: will be either build or production |
| deviceId | 32-digit uuid identifying the registered device |
| groupId | identifyer of the Tangerine group to which this device is registered |
| complete | TRUE or FALSE, whether the form is complete |
| tangerineModifiedByUserId 3 | 2-digit uuid identifying the registered user who filled the form |
| caseId | Only for Case module configuration,32-digit uuid identifying the Case the form is associated with |
| eventId | Only for Case module configuration, 32-digit uuid identifying the Event within the Case that the form is associated with |
| eventFormId | Only for Case module configuration, 32-digit uuid identifying the Form within the Event within the Case that the form is associated with |
| participantId | Only for Case module configuration, 32-digit uuid identifying the participant for whom the form was filled |
| GridVar.duration | For a grid variable GridVar, this indicates the time limit/duration for the grid |
| GridVar.time_remaining | For a grid variable GridVar, this indicates the time remaining on the grid |
| GridVar.gridAutoStopped | For a grid variable GridVar, this indicates if the grid stopped using the auto stop rule |
| GridVar.autoStop | For a grid variable GridVar, this indicates the number of items that trigger the auto stop |
| GridVar.item_at_time | For a grid variable GridVar, this indicates the item at the Xth second |
| GridVar. time_intermediate_captured | For a grid variable GridVar, indicates the time time of the intermediate capture. |
| GridVar.number_of_items_correct | For a grid variable GridVar, indicates the number of correct items on the grid |
| GridVar.number_of_items_attempted | For a grid variable GridVar, indicates the number of items attempted on the grid |
| GridVar.items_per_minute | For a grid variable GridVar, indicates the number of items per minute read by the child. |
| SectionId_firstOpenTime | For a section with ID "sectionId" this it eh time stamp when it was first opened. |
| sr_classId | For Teach module configuration, the Id of the class for this student |
| sr_studentId | For Teach module configuration, the Id of the student |
User Profile Metadata
The information for the user logged in to the Tangerine app is also included in the CSV outputs. This includes the metadata below. The location metadata is based on the location defined in the location list. The table below includes three location levels as an example.
| Variable Name | Meaning |
|---|---|
| user-profile._id | 32-digit uuid identifying the registered user who filled the form |
| user-profile.item-1_firstOpenTime | unix timestamp of when the form was opened |
| user-profile.item-1.first_name | user's first name |
| user-profile.item-1.last_name | user's last name |
| user-profile.item-1.gender | user's gender |
| user-profile.item-1.phone | user's phone number |
| user-profile.item-1.location.Region | user's assigned Region |
| user-profile.item-1.location.District | user's assigned District |
| user-profile.item-1.location.Village | user's assigned Village |
UNIX Timestamps conversion
To convert any of the unix timestamp inputs to readable dates, use this formula in Excel in a new column:
=A2/(60*60*24000) +"1/1/1970" Replace the A column with the corresponding column containing the timestamp. Now select the entire column and format it as Date or date + time. This will give you the human readable date and time.
What can I do with Tangerine’s timestamps?
Check precise duration of an assessment or subtests. If you notice your overall assessment time (per assessor or per group) is lengthy, you may wish to use the timestamps to provide data on which subtests are the most time consuming. Confirm when data was collected. If you have suspicions that your data collector may have manually changed the values on your Date/Time screen against your instructions, you can check for inconsistencies between the Date/Time subtest data and the timestamps, as these cannot be altered by the user unless s/he also alters the date and time settings on the device.